Python
yfinance 모듈 사용해보기
J.H_DA
2022. 3. 21. 16:48
yfinances는 파이썬을 통해 주식의 데이터를 가져올 수 있는 모듈이다.
import yfinance as yf
import pandas as pd
import matplotlib.pyplot as plt
In [30]:
data=yf.download(['AAPL',"TSLA","CPNG"],start='2019-01-01') #뒤에 인자값들을 시작값으로함. 스타트는 1월1일인데 전날도 포함된
[*********************100%***********************] 3 of 3 completed
In [21]:
data['Close']["AAPL"]
Out[21]:
Date
2018-12-31     39.435001
2019-01-02     39.480000
2019-01-03     35.547501
2019-01-04     37.064999
2019-01-07     36.982498
                 ...
2022-03-14    150.619995
2022-03-15    155.089996
2022-03-16    159.589996
2022-03-17    160.619995
2022-03-18    163.979996
Name: AAPL, Length: 811, dtype: float64
In [24]:
aapl = yf.Ticker("AAPL")
In [23]:
aapl.dividends # 애플 주식의 배당 내역
Out[23]:
Date
1987-05-11    0.000536
1987-08-10    0.000536
1987-11-17    0.000714
1988-02-12    0.000714
1988-05-16    0.000714
                ...
2021-02-05    0.205000
2021-05-07    0.220000
2021-08-06    0.220000
2021-11-05    0.220000
2022-02-04    0.220000
Name: Dividends, Length: 74, dtype: float64
In [25]:
aapl.splits # 주당분할
Out[25]:
Date
1987-06-16    2.0
2000-06-21    2.0
2005-02-28    2.0
2014-06-09    7.0
2020-08-31    4.0
Name: Stock Splits, dtype: float64
In [27]:
aapl.recommendations # 애널리스트 정보
Out[27]:
FirmTo GradeFrom GradeActionDate2012-02-09 08:17:002012-03-08 07:33:002012-03-13 06:08:002012-03-14 06:13:002012-03-14 08:21:00...2022-01-28 14:19:012022-01-28 15:10:562022-01-31 15:44:192022-02-15 15:31:582022-03-11 11:57:08
| Canaccord Genuity | Buy | main | |
| FBN Securities | Outperform | main | |
| Jefferies | Buy | main | |
| Morgan Stanley | Overweight | main | |
| Canaccord Genuity | Buy | main | |
| ... | ... | ... | ... |
| New Street Research | Neutral | Sell | up |
| Oppenheimer | Outperform | main | |
| Credit Suisse | Neutral | main | |
| Tigress Financial | Strong Buy | main | |
| Barclays | Equal-Weight | main |
831 rows × 4 columns
In [28]:
aapl.info # 애플 회사의 정보
Out[28]:
{'zip': '95014',
 'sector': 'Technology',
 'fullTimeEmployees': 100000,
 'longBusinessSummary': 'Apple Inc. designs, manufactures, and markets smartphones, personal computers, tablets, wearables, and accessories worldwide. It also sells various related services. In addition, the company offers iPhone, a line of smartphones; Mac, a line of personal computers; iPad, a line of multi-purpose tablets; AirPods Max, an over-ear wireless headphone; and wearables, home, and accessories comprising AirPods, Apple TV, Apple Watch, Beats products, HomePod, and iPod touch. Further, it provides AppleCare support services; cloud services store services; and operates various platforms, including the App Store that allow customers to discover and download applications and digital content, such as books, music, video, games, and podcasts. Additionally, the company offers various services, such as Apple Arcade, a game subscription service; Apple Music, which offers users a curated listening experience with on-demand radio stations; Apple News+, a subscription news and magazine service; Apple TV+, which offers exclusive original content; Apple Card, a co-branded credit card; and Apple Pay, a cashless payment service, as well as licenses its intellectual property. The company serves consumers, and small and mid-sized businesses; and the education, enterprise, and government markets. It distributes third-party applications for its products through the App Store. The company also sells its products through its retail and online stores, and direct sales force; and third-party cellular network carriers, wholesalers, retailers, and resellers. Apple Inc. was incorporated in 1977 and is headquartered in Cupertino, California.',
 'city': 'Cupertino',
 'phone': '408 996 1010',
 'state': 'CA',
 'country': 'United States',
 'companyOfficers': [],
 'website': 'https://www.apple.com',
 'maxAge': 1,
 'address1': 'One Apple Park Way',
 'industry': 'Consumer Electronics',
 'ebitdaMargins': 0.33890998,
 'profitMargins': 0.26579002,
 'grossMargins': 0.43019,
 'operatingCashflow': 112241000448,
 'revenueGrowth': 0.112,
 'operatingMargins': 0.309,
 'ebitda': 128217997312,
 'targetLowPrice': 160,
 'recommendationKey': 'buy',
 'grossProfits': 152836000000,
 'freeCashflow': 80153247744,
 'targetMedianPrice': 199.5,
 'currentPrice': 163.98,
 'earningsGrowth': 0.25,
 'currentRatio': 1.038,
 'returnOnAssets': 0.19875,
 'numberOfAnalystOpinions': 44,
 'targetMeanPrice': 193.53,
 'debtToEquity': 170.714,
 'returnOnEquity': 1.45567,
 'targetHighPrice': 215,
 'totalCash': 63913000960,
 'totalDebt': 122797998080,
 'totalRevenue': 378323009536,
 'totalCashPerShare': 3.916,
 'financialCurrency': 'USD',
 'revenuePerShare': 22.838,
 'quickRatio': 0.875,
 'recommendationMean': 1.8,
 'exchange': 'NMS',
 'shortName': 'Apple Inc.',
 'longName': 'Apple Inc.',
 'exchangeTimezoneName': 'America/New_York',
 'exchangeTimezoneShortName': 'EDT',
 'isEsgPopulated': False,
 'gmtOffSetMilliseconds': '-14400000',
 'quoteType': 'EQUITY',
 'symbol': 'AAPL',
 'messageBoardId': 'finmb_24937',
 'market': 'us_market',
 'annualHoldingsTurnover': None,
 'enterpriseToRevenue': 7.229,
 'beta3Year': None,
 'enterpriseToEbitda': 21.33,
 '52WeekChange': 0.32895696,
 'morningStarRiskRating': None,
 'forwardEps': 6.56,
 'revenueQuarterlyGrowth': None,
 'sharesOutstanding': 16319399936,
 'fundInceptionDate': None,
 'annualReportExpenseRatio': None,
 'totalAssets': None,
 'bookValue': 4.402,
 'sharesShort': 110322490,
 'sharesPercentSharesOut': 0.0068,
 'fundFamily': None,
 'lastFiscalYearEnd': 1632528000,
 'heldPercentInstitutions': 0.59438,
 'netIncomeToCommon': 100554997760,
 'trailingEps': 6.015,
 'lastDividendValue': 0.22,
 'SandP52WeekChange': 0.13260198,
 'priceToBook': 37.251247,
 'heldPercentInsiders': 0.0007,
 'nextFiscalYearEnd': 1695600000,
 'yield': None,
 'mostRecentQuarter': 1640390400,
 'shortRatio': 1.2,
 'sharesShortPreviousMonthDate': 1643587200,
 'floatShares': 16302795170,
 'beta': 1.185531,
 'enterpriseValue': 2734947041280,
 'priceHint': 2,
 'threeYearAverageReturn': None,
 'lastSplitDate': 1598832000,
 'lastSplitFactor': '4:1',
 'legalType': None,
 'lastDividendDate': 1643932800,
 'morningStarOverallRating': None,
 'earningsQuarterlyGrowth': 0.204,
 'priceToSalesTrailing12Months': 7.0734663,
 'dateShortInterest': 1646006400,
 'pegRatio': 1.76,
 'ytdReturn': None,
 'forwardPE': 24.99695,
 'lastCapGain': None,
 'shortPercentOfFloat': 0.0068,
 'sharesShortPriorMonth': 91388112,
 'impliedSharesOutstanding': 0,
 'category': None,
 'fiveYearAverageReturn': None,
 'previousClose': 160.62,
 'regularMarketOpen': 160.51,
 'twoHundredDayAverage': 154.44424,
 'trailingAnnualDividendYield': 0.005385382,
 'payoutRatio': 0.1434,
 'volume24Hr': None,
 'regularMarketDayHigh': 164.48,
 'navPrice': None,
 'averageDailyVolume10Day': 102416350,
 'regularMarketPreviousClose': 160.62,
 'fiftyDayAverage': 166.5874,
 'trailingAnnualDividendRate': 0.865,
 'open': 160.51,
 'toCurrency': None,
 'averageVolume10days': 102416350,
 'expireDate': None,
 'algorithm': None,
 'dividendRate': 0.88,
 'exDividendDate': 1643932800,
 'circulatingSupply': None,
 'startDate': None,
 'regularMarketDayLow': 159.76,
 'currency': 'USD',
 'trailingPE': 27.261845,
 'regularMarketVolume': 123511692,
 'lastMarket': None,
 'maxSupply': None,
 'openInterest': None,
 'marketCap': 2676055080960,
 'volumeAllCurrencies': None,
 'strikePrice': None,
 'averageVolume': 93071551,
 'dayLow': 159.76,
 'ask': 164.34,
 'askSize': 1400,
 'volume': 123511692,
 'fiftyTwoWeekHigh': 182.94,
 'fromCurrency': None,
 'fiveYearAvgDividendYield': 1.13,
 'fiftyTwoWeekLow': 118.86,
 'bid': 164.28,
 'tradeable': False,
 'dividendYield': 0.0054,
 'bidSize': 900,
 'dayHigh': 164.48,
 'regularMarketPrice': 163.98,
 'preMarketPrice': None,
 'logo_url': 'https://logo.clearbit.com/apple.com',
 'trailingPegRatio': 3.0052}
In [29]:
aapl.history(period="max") # 애플의 주가 역사
Out[29]:
OpenHighLowCloseVolumeDividendsStock SplitsDate1980-12-121980-12-151980-12-161980-12-171980-12-18...2022-03-142022-03-152022-03-162022-03-172022-03-18
| 0.100323 | 0.100759 | 0.100323 | 0.100323 | 469033600 | 0.0 | 0.0 |
| 0.095525 | 0.095525 | 0.095089 | 0.095089 | 175884800 | 0.0 | 0.0 |
| 0.088546 | 0.088546 | 0.088110 | 0.088110 | 105728000 | 0.0 | 0.0 |
| 0.090291 | 0.090727 | 0.090291 | 0.090291 | 86441600 | 0.0 | 0.0 |
| 0.092908 | 0.093345 | 0.092908 | 0.092908 | 73449600 | 0.0 | 0.0 |
| ... | ... | ... | ... | ... | ... | ... |
| 151.449997 | 154.119995 | 150.100006 | 150.619995 | 108732100 | 0.0 | 0.0 |
| 150.899994 | 155.570007 | 150.380005 | 155.089996 | 92964300 | 0.0 | 0.0 |
| 157.050003 | 160.000000 | 154.460007 | 159.589996 | 102300200 | 0.0 | 0.0 |
| 158.610001 | 161.000000 | 157.630005 | 160.619995 | 75615400 | 0.0 | 0.0 |
| 160.509995 | 164.479996 | 159.759995 | 163.979996 | 123351200 | 0.0 | 0.0 |
10405 rows × 7 columns
In [32]:
cpng = yf.Ticker("CPNG")
aapl.info
aapl.history(period="max")
Out[32]:
OpenHighLowCloseVolumeDividendsStock SplitsDate1980-12-121980-12-151980-12-161980-12-171980-12-18...2022-03-142022-03-152022-03-162022-03-172022-03-18
| 0.100323 | 0.100759 | 0.100323 | 0.100323 | 469033600 | 0.0 | 0.0 |
| 0.095525 | 0.095525 | 0.095089 | 0.095089 | 175884800 | 0.0 | 0.0 |
| 0.088546 | 0.088546 | 0.088110 | 0.088110 | 105728000 | 0.0 | 0.0 |
| 0.090291 | 0.090727 | 0.090291 | 0.090291 | 86441600 | 0.0 | 0.0 |
| 0.092908 | 0.093345 | 0.092908 | 0.092908 | 73449600 | 0.0 | 0.0 |
| ... | ... | ... | ... | ... | ... | ... |
| 151.449997 | 154.119995 | 150.100006 | 150.619995 | 108732100 | 0.0 | 0.0 |
| 150.899994 | 155.570007 | 150.380005 | 155.089996 | 92964300 | 0.0 | 0.0 |
| 157.050003 | 160.000000 | 154.460007 | 159.589996 | 102300200 | 0.0 | 0.0 |
| 158.610001 | 161.000000 | 157.630005 | 160.619995 | 75615400 | 0.0 | 0.0 |
| 160.509995 | 164.479996 | 159.759995 | 163.979996 | 123351200 | 0.0 | 0.0 |
10405 rows × 7 columns
In [34]:
import pyupbit as upbit
upbit.get_tickers(fiat="KRW")
Out[34]:
['KRW-BTC',
 'KRW-ETH',
 'KRW-NEO',
 'KRW-MTL',
 'KRW-LTC',
 'KRW-XRP',
 'KRW-ETC',
 'KRW-OMG',
 'KRW-SNT',
 'KRW-WAVES',
 'KRW-XEM',
 'KRW-QTUM',
 'KRW-LSK',
 'KRW-STEEM',
 'KRW-XLM',
 'KRW-ARDR',
 'KRW-ARK',
 'KRW-STORJ',
 'KRW-GRS',
 'KRW-REP',
 'KRW-ADA',
 'KRW-SBD',
 'KRW-POWR',
 'KRW-BTG',
 'KRW-ICX',
 'KRW-EOS',
 'KRW-TRX',
 'KRW-SC',
 'KRW-ONT',
 'KRW-ZIL',
 'KRW-POLY',
 'KRW-ZRX',
 'KRW-LOOM',
 'KRW-BCH',
 'KRW-BAT',
 'KRW-IOST',
 'KRW-RFR',
 'KRW-CVC',
 'KRW-IQ',
 'KRW-IOTA',
 'KRW-MFT',
 'KRW-ONG',
 'KRW-GAS',
 'KRW-UPP',
 'KRW-ELF',
 'KRW-KNC',
 'KRW-BSV',
 'KRW-THETA',
 'KRW-QKC',
 'KRW-BTT',
 'KRW-MOC',
 'KRW-ENJ',
 'KRW-TFUEL',
 'KRW-MANA',
 'KRW-ANKR',
 'KRW-AERGO',
 'KRW-ATOM',
 'KRW-TT',
 'KRW-CRE',
 'KRW-MBL',
 'KRW-WAXP',
 'KRW-HBAR',
 'KRW-MED',
 'KRW-MLK',
 'KRW-STPT',
 'KRW-ORBS',
 'KRW-VET',
 'KRW-CHZ',
 'KRW-STMX',
 'KRW-DKA',
 'KRW-HIVE',
 'KRW-KAVA',
 'KRW-AHT',
 'KRW-LINK',
 'KRW-XTZ',
 'KRW-BORA',
 'KRW-JST',
 'KRW-CRO',
 'KRW-TON',
 'KRW-SXP',
 'KRW-HUNT',
 'KRW-PLA',
 'KRW-DOT',
 'KRW-SRM',
 'KRW-MVL',
 'KRW-STRAX',
 'KRW-AQT',
 'KRW-GLM',
 'KRW-SSX',
 'KRW-META',
 'KRW-FCT2',
 'KRW-CBK',
 'KRW-SAND',
 'KRW-HUM',
 'KRW-DOGE',
 'KRW-STRK',
 'KRW-PUNDIX',
 'KRW-FLOW',
 'KRW-DAWN',
 'KRW-AXS',
 'KRW-STX',
 'KRW-XEC',
 'KRW-SOL',
 'KRW-MATIC',
 'KRW-NU',
 'KRW-AAVE',
 'KRW-1INCH',
 'KRW-ALGO',
 'KRW-NEAR',
 'KRW-WEMIX',
 'KRW-AVAX',
 'KRW-T',
 'KRW-CELO']
In [37]:
upbit.get_current_price(["KRW-BTC", "KRW-ETH"])
Out[37]:
{'KRW-BTC': 50028000.0, 'KRW-ETH': 3482000.0}In [46]:
ticker = "KRW-BTC"
interval="minute1"
to ="2022-01-01 00:00"
count=100
upbit.get_ohlcv(ticker=ticker, interval=interval)
Out[46]:
openhighlowclosevolumevalue2022-03-21 10:32:002022-03-21 10:33:002022-03-21 10:34:002022-03-21 10:35:002022-03-21 10:36:00...2022-03-21 13:47:002022-03-21 13:48:002022-03-21 13:49:002022-03-21 13:50:002022-03-21 13:51:00
| 50578000.0 | 50597000.0 | 50557000.0 | 50560000.0 | 0.797741 | 4.034548e+07 |
| 50557000.0 | 50645000.0 | 50557000.0 | 50619000.0 | 2.079545 | 1.052432e+08 |
| 50639000.0 | 50660000.0 | 50618000.0 | 50639000.0 | 0.593488 | 3.005209e+07 |
| 50639000.0 | 50658000.0 | 50619000.0 | 50658000.0 | 2.127970 | 1.077808e+08 |
| 50658000.0 | 50658000.0 | 50620000.0 | 50645000.0 | 1.808827 | 9.161522e+07 |
| ... | ... | ... | ... | ... | ... |
| 50060000.0 | 50080000.0 | 50060000.0 | 50075000.0 | 1.031175 | 5.162954e+07 |
| 50060000.0 | 50075000.0 | 50025000.0 | 50060000.0 | 4.791390 | 2.398578e+08 |
| 50060000.0 | 50081000.0 | 50060000.0 | 50060000.0 | 1.840917 | 9.217908e+07 |
| 50064000.0 | 50075000.0 | 50060000.0 | 50061000.0 | 2.164085 | 1.083352e+08 |
| 50061000.0 | 50075000.0 | 50060000.0 | 50061000.0 | 2.758902 | 1.381130e+08 |
200 rows × 6 columns
In [68]:
#### 3시 30분꺼지 프리하게 데이터 튜닝
# 주식, 코인 데이터를 가지고 데이터의 갯수 1000개 선택
# 데이터를 csv로 변환
# csv를 DB에 삽입
# mysql을 가지고 쿼리문으로 데이터를 받아와서(모듈로 생성, class로 구현)
# 주식의 기준-> 시가, 종가, 고가, 저가 소수점 2번째 자리까지 유지 반올림
# 주식 기준 NAn값 존재 시작되는 지점의 시가로 변환
# 컬럼을 하나 추가 종가-시가의 값을 삽입
# (등락폭/시가*100) 퍼센트 삽입
# 데이터 시각화-> 시가/종가 등락폭/볼륨 그래프 4개를 한 plot 표시
In [53]:
data=yf.download("NVDA",start='2018-01-01')
[*********************100%***********************] 1 of 1 completed
In [54]:
a=pd.DataFrame(data)
In [55]:
a["Gap"]=(a["Close"] - a["Open"].shift()).fillna(0)
In [56]:
a["Ratio"]=(((a["Gap"]/a["Open"])*100).shift()).fillna(0)
In [57]:
a
Out[57]:
OpenHighLowCloseAdj CloseVolumeGapRatioDate2018-01-022018-01-032018-01-042018-01-052018-01-08...2022-03-142022-03-152022-03-162022-03-172022-03-18
| 48.945000 | 49.875000 | 48.625000 | 49.837502 | 49.372402 | 35561600 | 0.000000 | 0.000000 |
| 51.025002 | 53.424999 | 50.937500 | 53.117500 | 52.621784 | 91470400 | 4.172501 | 0.000000 |
| 53.939999 | 54.512501 | 53.172501 | 53.397499 | 52.899174 | 58326800 | 2.372498 | 8.177365 |
| 53.547501 | 54.227501 | 52.770000 | 53.849998 | 53.347446 | 58012400 | -0.090000 | 4.398401 |
| 55.099998 | 56.250000 | 54.645000 | 55.500000 | 54.982040 | 88121600 | 1.952499 | -0.168075 |
| ... | ... | ... | ... | ... | ... | ... | ... |
| 218.690002 | 222.619995 | 211.589996 | 213.300003 | 213.300003 | 38535400 | -16.919998 | -1.872121 |
| 215.179993 | 230.380005 | 213.220001 | 229.729996 | 229.729996 | 49199600 | 11.039993 | -7.736978 |
| 235.000000 | 245.970001 | 231.720001 | 244.960007 | 244.960007 | 67142200 | 29.780014 | 5.130585 |
| 241.199997 | 248.419998 | 239.059998 | 247.660004 | 247.660004 | 47194100 | 12.660004 | 12.672346 |
| 247.990005 | 265.690002 | 246.240005 | 264.529999 | 264.529999 | 72977200 | 23.330002 | 5.248758 |
1061 rows × 8 columns
In [58]:
b=a.to_csv("./nvda_stock.csv")
In [59]:
import mod_sql
In [61]:
_db = mod_sql.Database()
sql = """SELECT * FROM nvda_stock"""

result = _db.executeAll(sql)
result1=pd.DataFrame(result)
result1.head()
Out[61]:
DateOpenHighLowCloseAdj CloseVolumeGapRatio01234
| 2018-01-02 | 48.945000 | 49.875000 | 48.625000 | 49.837502 | 49.372402 | 35561600 | 0.000000 | 0.000000 |
| 2018-01-03 | 51.025002 | 53.424999 | 50.937500 | 53.117500 | 52.621784 | 91470400 | 4.172501 | 0.000000 |
| 2018-01-04 | 53.939999 | 54.512501 | 53.172501 | 53.397499 | 52.899174 | 58326800 | 2.372498 | 8.177365 |
| 2018-01-05 | 53.547501 | 54.227501 | 52.770000 | 53.849998 | 53.347446 | 58012400 | -0.090000 | 4.398401 |
| 2018-01-08 | 55.099998 | 56.250000 | 54.645000 | 55.500000 | 54.982040 | 88121600 | 1.952499 | -0.168075 |
In [62]:
result1["Date"]=pd.to_datetime(result1["Date"], format="%Y-%m-%d")
In [64]:
result1["Open"]=round(result1["Open"],2)
In [65]:
result1["High"]=round(result1["High"],2)
result1["Low"]=round(result1["Low"],2)
result1["Close"]=round(result1["Close"],2)
In [67]:
result1.fillna(method="ffill")
Out[67]:
DateOpenHighLowCloseAdj CloseVolumeGapRatio01234...10561057105810591060
| 2018-01-02 | 48.94 | 49.88 | 48.62 | 49.84 | 49.372402 | 35561600 | 0.000000 | 0.000000 |
| 2018-01-03 | 51.03 | 53.42 | 50.94 | 53.12 | 52.621784 | 91470400 | 4.172501 | 0.000000 |
| 2018-01-04 | 53.94 | 54.51 | 53.17 | 53.40 | 52.899174 | 58326800 | 2.372498 | 8.177365 |
| 2018-01-05 | 53.55 | 54.23 | 52.77 | 53.85 | 53.347446 | 58012400 | -0.090000 | 4.398401 |
| 2018-01-08 | 55.10 | 56.25 | 54.65 | 55.50 | 54.982040 | 88121600 | 1.952499 | -0.168075 |
| ... | ... | ... | ... | ... | ... | ... | ... | ... |
| 2022-03-14 | 218.69 | 222.62 | 211.59 | 213.30 | 213.300003 | 38535400 | -16.919998 | -1.872121 |
| 2022-03-15 | 215.18 | 230.38 | 213.22 | 229.73 | 229.729996 | 49199600 | 11.039993 | -7.736978 |
| 2022-03-16 | 235.00 | 245.97 | 231.72 | 244.96 | 244.960007 | 67142200 | 29.780014 | 5.130585 |
| 2022-03-17 | 241.20 | 248.42 | 239.06 | 247.66 | 247.660004 | 47194100 | 12.660004 | 12.672346 |
| 2022-03-18 | 247.99 | 265.69 | 246.24 | 264.53 | 264.529999 | 72977200 | 23.330002 | 5.248758 |
1061 rows × 9 columns
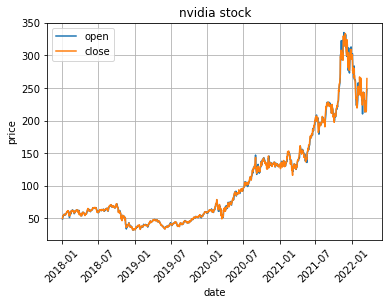
In [69]:
_date=result1["Date"]
_open=result1["Open"]
_close = result1["Close"]
plt.plot(_date, _open)
plt.plot(_date, _close)
plt.xlabel("date")
plt.ylabel("price")
plt.legend(["open", "close"])
plt.title("nvidia stock")
plt.xticks(rotation=45)
plt.grid(True)
In [ ]:
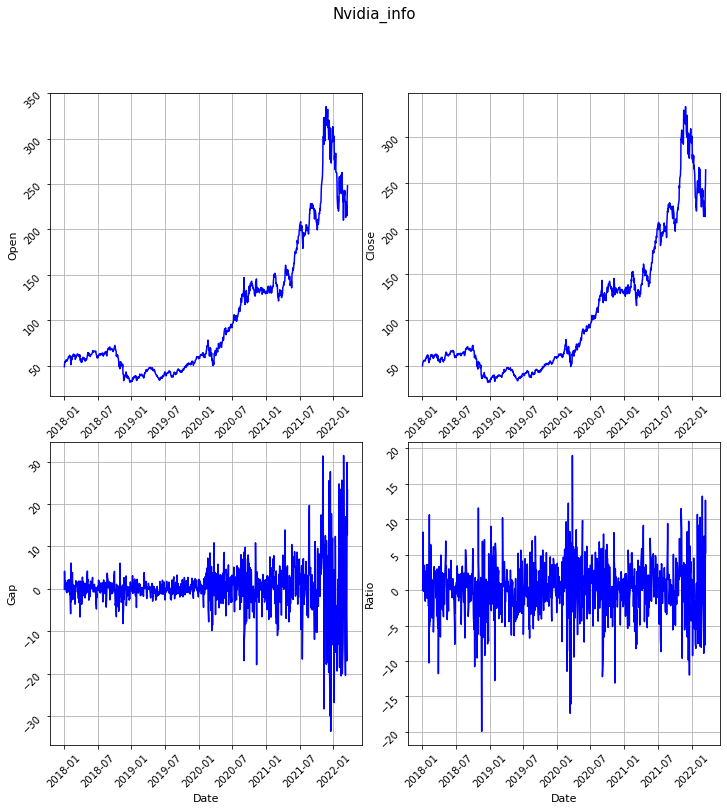
In [86]:
f, axes = plt.subplots(2, 2)
f.set_size_inches((12, 12))
plt.subplots_adjust(wspace = 0.15, hspace = 0.15)

# figure 전체 제목
f.suptitle('Nvidia_info', fontsize = 15)


# 선 그래프 예시(축 제목 설정)
axes[0, 0].plot(result1["Date"], result1["Open"], color = 'blue')
axes[0, 0].set_xlabel('Date', fontsize = 11)
axes[0, 0].set_ylabel('Open', fontsize = 11)
axes[0, 0].tick_params(labelrotation=45)
axes[0, 0].grid(True)

axes[0, 1].plot(result1["Date"], result1["Close"], color = 'blue')
axes[0, 1].set_xlabel('Date', fontsize = 11)
axes[0, 1].set_ylabel('Close', fontsize = 11)
axes[0, 1].tick_params(labelrotation=45)
axes[0, 1].grid(True)

axes[1, 0].plot(result1["Date"], result1["Gap"], color = 'blue')
axes[1, 0].set_xlabel('Date', fontsize = 11)
axes[1, 0].set_ylabel('Gap', fontsize = 11)
axes[1, 0].tick_params(labelrotation=45)
axes[1, 0].grid(True)

axes[1, 1].plot(result1["Date"], result1["Ratio"], color = 'blue')
axes[1, 1].set_xlabel('Date', fontsize = 11)
axes[1, 1].set_ylabel('Ratio', fontsize = 11)
axes[1, 1].tick_params(labelrotation=45)
axes[1, 1].grid(True)


plt.show()
728x90